Our post on arrest rates by race ended with a striking fact: more than half of all American Indian/Alaska Native student arrests in 2021-22 were concentrated in just 7 school districts. Nationwide, 529 American Indian students were reported arrested – a small number, but one that is geographically extreme in its concentration.
The table below shows those 7 districts. Two things jump out immediately. First, these are small communities: the largest district enrolls just over 2,000 American Indian students; the smallest enrolls only 58. Second, their arrest rates are far above the national average of 1.16 arrests per 1,000 American Indian students – in some cases by an order of magnitude.
Extreme values in small populations are worth examining carefully. They can reflect real patterns, data errors, or one-time events. Before we accept or dismiss these numbers, we should look closer.
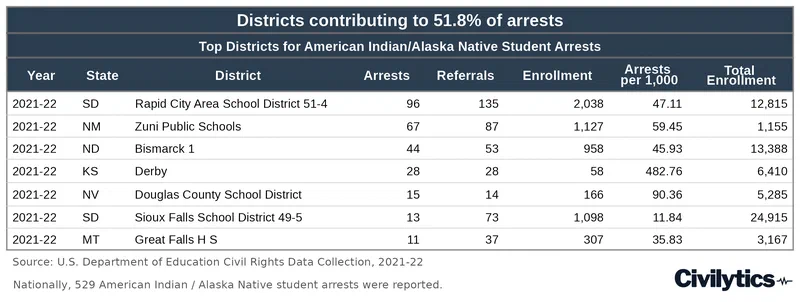
A first step is to look at these same districts across multiple waves of CRDC data. If the 2021-22 numbers reflect a true increase – not a reporting anomaly – we would expect to see some consistency or a clear trend over time. The table below shows arrest counts for each of these 7 districts across the three available CRDC waves: 2015-16, 2017-18, and 2021-22.
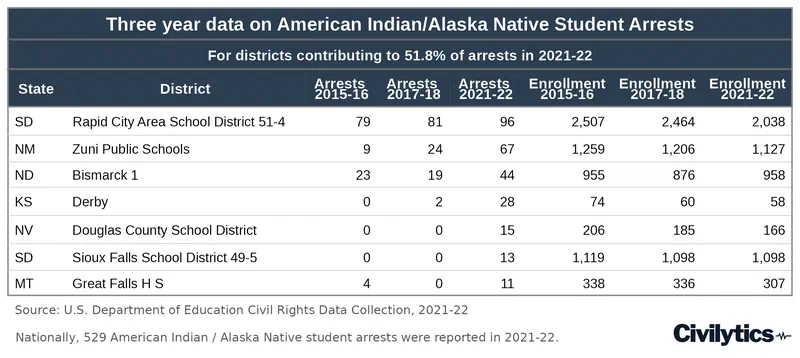
In every case, arrest counts in 2021-22 are the highest across the three waves. In some districts – like Douglas County, Nevada – this is the first wave with any reported AM arrests. In others, like Rapid City, South Dakota, numbers have grown steadily across waves. This is notable because nationally, arrest totals fell in 2021-22 compared to prior years. These 7 districts are moving opposite to the national trend.
Descriptive patterns can only take us so far. What we really want to know is: how plausible are these values? How likely are they to reflect the true arrest totals as opposed to being data quality or measurement issues? One direct approach would be to contact the districts. If you are working locally, this can be a great option! But at a national scale to investigate elevated arrests for small student groups across many districts, we also want statistical tools that help us evaluate plausibility. That’s where statistical models come in.
We’ll use Sioux Falls, South Dakota as an illustrative example. Sioux Falls reported 0 AM student arrests in both 2015-16 and 2017-18, then reported over 10 arrests in 2021-22. That’s a striking jump, and it raises a natural question: does the data rule out a reporting error?
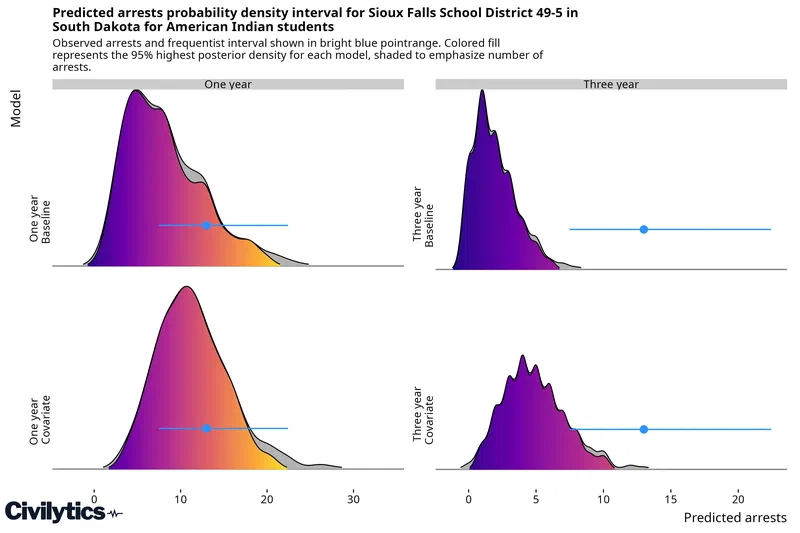
As a first check, we can apply the binomial distribution – treating enrollment as the number of trials and constructing a 95% confidence interval around the reported arrest count. The bright blue pointrange in the figure below shows this frequentist interval. It does not overlap 0: using only the 2021-22 enrollment and arrest data, we can rule out zero arrests.
But that frequentist interval is wide and uses only a single year of observed data. The panel figure below shows multiple model estimates for Sioux Falls side by side, ranging from a simple single-year, no-covariate model (top left) to a richer model incorporating all three waves of CRDC data plus referrals to law enforcement as a covariate and accounting for state and student group effects (bottom right). Each panel shows the full probability distribution of predicted arrests in gray; the colored region is the 95% highest posterior density interval.
Two patterns emerge clearly. First, adding more years of data (moving from column 1 to column 2) depresses the estimate – models that incorporate prior waves where arrests were zero assign more probability mass to low counts, making 0 more plausible in 2021-22 than the simple binomial interval suggests. Second, adding covariates (moving from row 1 to row 2) increases the estimated plausible range – covariates like referrals add evidence that some arrests did occur, pushing estimates upward.
In every panel, model estimates are lower than the reported data, and the frequentist interval includes values – arrest counts above 20 – that no model considers likely. The spikiness in the right panels is not a display artifact: these models output discrete arrest counts, and when only a few values have meaningful probability, the smoothed density shows sharp peaks.
Which set of estimates is most trustworthy? Why do models diverge, and what should we do when they do? We’ll unpack that in future posts on a single district’s reported zero and on how other fields estimate rare events.1
This research was supported by a grant from the American Educational Research Association which receives funds for its “AERA Grants Program” from the National Science Foundation under NSF award NSF-DRL #1749275. Opinions reflect those of the author and do not necessarily reflect those AERA or NSF.
The question of which model is most appropriate involves choices about how much to trust prior years, which covariates to include, and how to handle the particular data-generating process for school arrests. Future posts will make those choices explicit. ↩︎