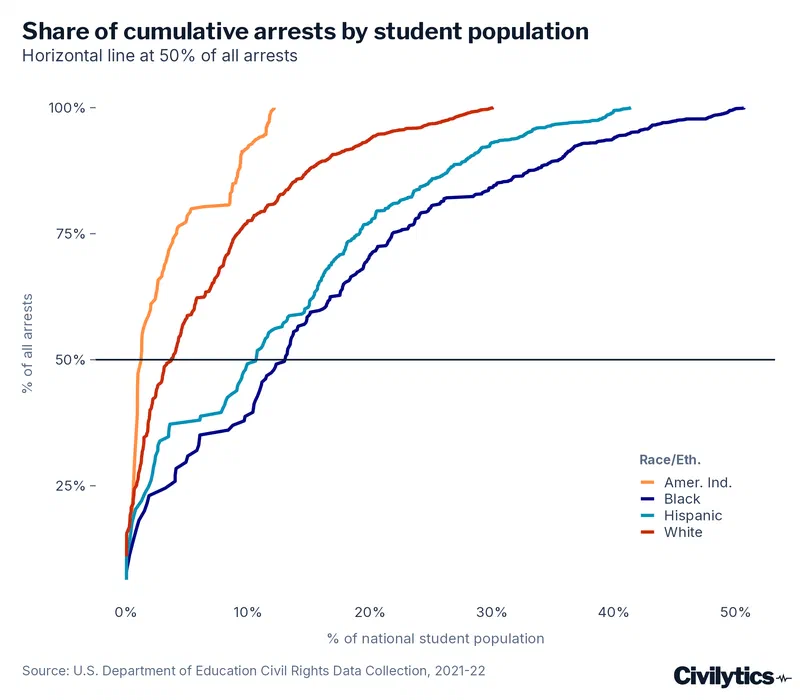
Over 50% of school-based arrests of American Indian/Alaskan Native students in 2021-22 occurred in just 7 districts.
Disparities in arrest rates by race/ethnicity, gender, and disability status are widely known and have been documented for years (e.g., for a small sampling of this work, see Darling-Hammond and Ho 2024 (opens in new tab); Homer and Fisher 2019 (opens in new tab); Whitaker et. al 2019 (opens in new tab); Civilytics’ 2017-18 CRDC analysis (opens in new tab)).
There are many different ways to describe these inequities.
We can talk about raw numbers: more Black female students were arrested than White female students despite there being 3 times as many White female students enrolled in U.S. public schools.
We can talk about arrest rates: White students had 0.51 arrests per 1,000 students, Hispanic students 0.66, American Indian/Alaskan Native students 1.16, and Black students 1.62 arrests per 1,000 students.
We can highlight the “number needed to harm.” While 1 in about 1,500 White males were arrested at school in 2021-22, 1 in about 500 Black males and 1 in about 700 American Indian/Alaskan Native males were arrested at school in 2021-22.
And we can talk about the geographic concentration of students by race – and therefore the geographic concentration of arrests by race. That leads us back to where this post started: over 50% of school-based arrests of American Indian/Alaskan Native students occurred in just 7 districts.
This research was supported by a grant from the American Educational Research Association which receives funds for its “AERA Grants Program” from the National Science Foundation under NSF award NSF-DRL #1749275. Opinions reflect those of the author and do not necessarily reflect those AERA or NSF.