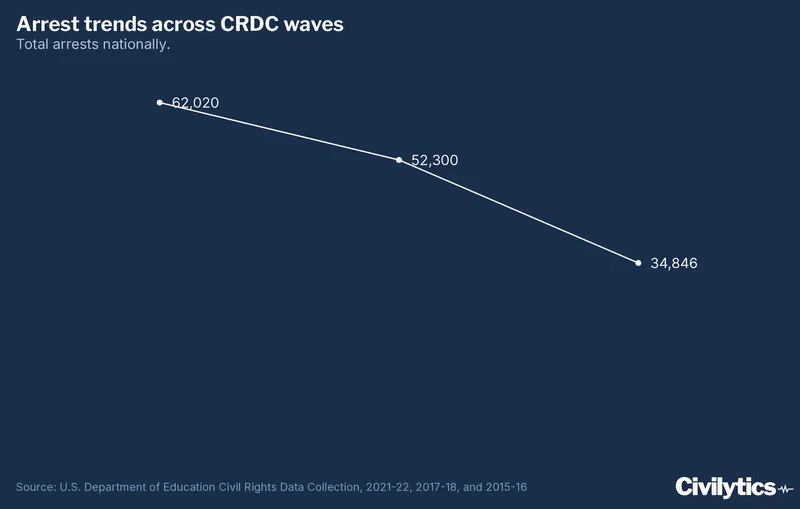
Overall, the number of students with school-related arrests declined by ~44% in the last three CRDC data collection waves*, from over 62,000 students arrested in 2015-16 to under 35,000 in 2021-22.
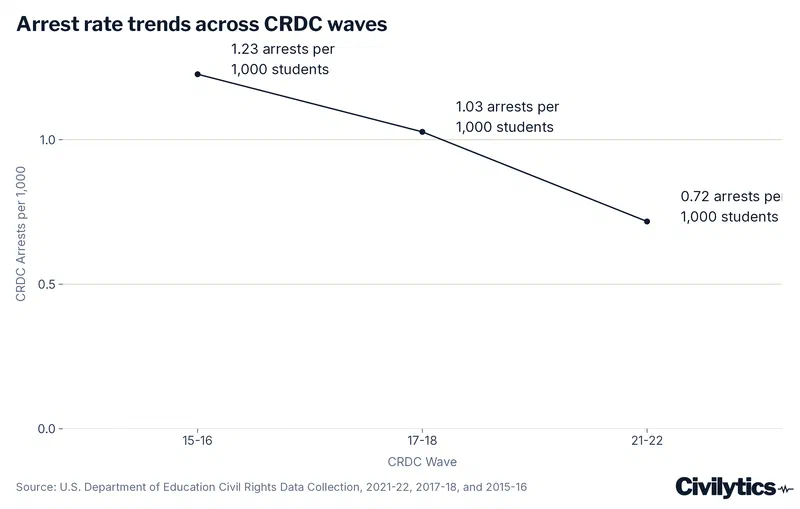
A big part of why we wanted to look at multiple years of data is not just to understand trends but because it’s easy to dismiss one year of data as a fluke, a possible data error, or simply not reliable. For example, looking at multiple years of data allows us to ask whether Kansas just had more school-related arrests than California in 2021-22 (despite having a student population 1/12th the size of CA) or if this is a consistent pattern across years?
In 2021-22 Kansas (allegedly) had 2,413 school-related arrests compared to 565 in 2017-18 and 521 in 2015-16.
In both of the prior years, Kansas did have arrest rates above the national average and above California’s.1 However, California, as expected, had many more total arrests than Kansas in both of those years.2
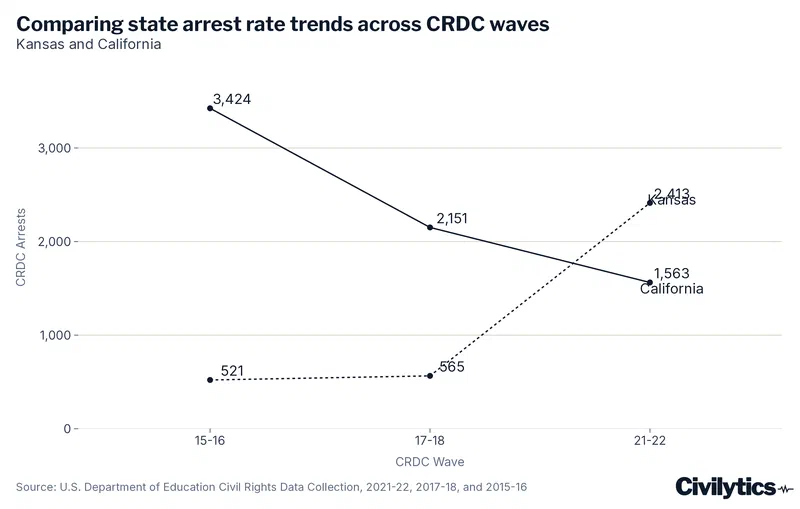
Taken together, the data indicate that Kansas does have a “higher than expected” school-based arrest rate and perhaps a more punitive approach to discipline than many states – but that there were likely one or more data errors in Kansas’s data for 2021-22.
Looking into Kansas
Looking into those data more, 87% of Kansas’s arrests in 2021-22 were (allegedly) from one district with ~6,500 students. Based on the reported data, the district (Derby Public Schools) would have an arrest rate of nearly 1 in 3 students in 2021-22. The district did have a very high reported arrest rate (1 in 63 students) in 2017-18 but not nearly as anomalous as in 2021-22.
Despite the Office of Civil Rights (opens in new tab) taking steps before, during, and after data collection to ensure good data quality, with over 17,000 districts reporting hundreds of data elements, it’s not feasible to identify and correct every possible data error. As we’ll discuss in future posts, part of the motivation for this study was to use statistical methods to improve the quality of descriptive reporting on data particularly in the case of highly consequential but rare events like arrests.
People are rightly skeptical of the influence outliers or data errors can have on even state-level descriptive statistics when looking at relatively rare events like arrests. This skepticism limits the utility of a valuable data collection. We hope through statistical analysis we can explore the extent to which we can recover the utility of these data and increase confidence in using the numbers to inform the public about arrests in schools not just overall or in particular states but in districts as well.
*A note on CRDC waves:
The CRDC is generally a biennial data collection. We examine data from the most recent year available, the 2021-22 school year, and from two prior collections, 2017-18 and 2015-16. There was also an off-cycle data collection in 2020-21 (due to the pandemic, the planned 2019-20 data collection was postponed). In 2020-21, only about a quarter as many arrests (9,738) and referrals (65,312) were reported as in 2021-22. We do not include 2020-21 data in these analyses because students’ and schools’ experiences during that time varied greatly depending on whether instruction was virtual, hybrid, or in-person along with other factors.
This research was supported by a grant from the American Educational Research Association which receives funds for its “AERA Grants Program” from the National Science Foundation under NSF award NSF-DRL #1749275. Opinions reflect those of the author and do not necessarily reflect those AERA or NSF.