The coefficient of variation is a standardized metric for the relative precision of a measurement. The more imprecise a measure is, the more difficult it is to attribute differences among observations to true underlying differences as opposed to variation resulting from measurement alone. In the case of arrest rates, the limitations of time (a single school year) and population (the district enrollment) mean that the arrest rate as captured by the Civil Rights Data Collection (CRDC) may be limited in its ability to describe true differences in arrest patterns.
We can see this three ways in the figure below.
First, the coefficients of variation are higher for arrests than referrals – school-based referrals to law enforcement are more frequent than school-based arrests, so there is less dispersion around their measurement.
Second, the CV decreases for both referrals and arrests as the student enrollment decile increases (i.e., as districts are larger), but does so much more consistently for referrals.
Third, student groups with smaller populations such as American Indian and Black students generally have less precise arrest rates than their counterparts in larger student groups.
These disparities in precision were one of the initial motivators for us to look into statistical methods to improve the precision of arrest rates and allow for more meaningful district-student group-level
comparisons.
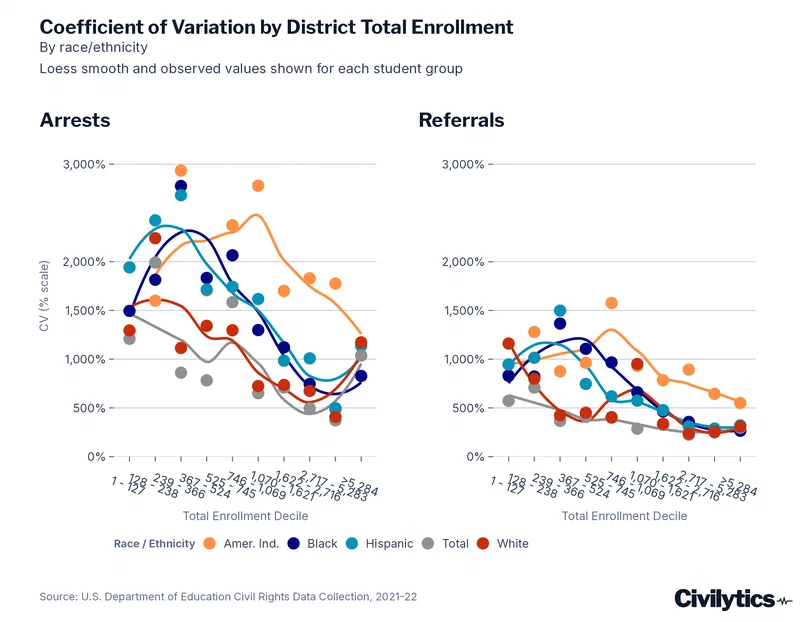
Another note: You may also notice that, for arrests, there is an uptick in the coefficient of variation for the largest districts. In a future post we will look at one potential source for this increased variance: underreporting of student arrests.
This research was supported by a grant from the American Educational Research Association which receives funds for its “AERA Grants Program” from the National Science Foundation under NSF award NSF-DRL #1749275. Opinions reflect those of the author and do not necessarily reflect those AERA or NSF.