We wrote this grant in large part because we wanted to examine district arrest rates in more detail. The district level is often the appropriate site of authority for the policies and procedures leading to school arrests and is where individual and collective actors (parents, students, school staff, and elected officials) can have the most immediate, direct, and demonstrable effect. Unfortunately, it’s also where errors or anomalies are most obvious, often leading folks to dismiss what can be learned from data.
In 2021-22, 11.6% of districts reported at least one arrest. Let’s look at which districts reported the most students arrested at “school” (i.e., with school-related arrests) in 2021-22. Because of the data error concern, let’s also look at what these districts reported in previous waves of the CRDC.
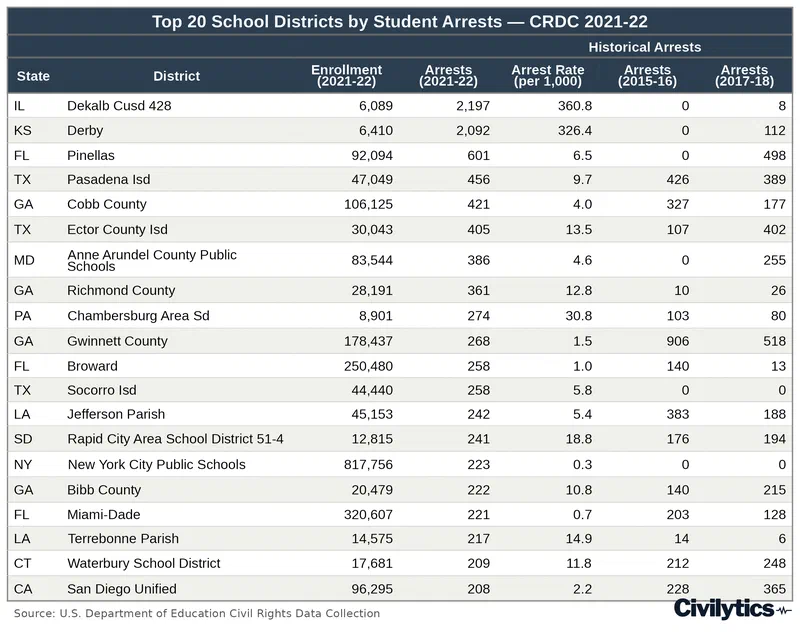
The table highlights at least four things:
There are wave-specific data errors for particular districts, such as the (implausibly) high number of arrests in DeKalb and Derby School Districts in 2021-22 and the alleged 0 arrests in Pinellas County, Anne Arundel County, NYC Public Schools, etc. in 2015-16.
Some districts have pretty consistent numbers of students arrested at school each year (wave) – for example, Pasadena (TX) consistently has around 400 students with school-based arrests, Jefferson Parish (LA) has around 200-300 students arrested, Rapid City (SD) consistently has around 200 students arrested.
This is not just a list of the largest school districts. There were 26 districts with >100k students in 2021-22 but only 5 of these districts are in the top 20 here. Some districts that are not especially large – like Waterbury School District in CT, Bibb County in GA, Chambersburg Area in PA – have relatively large numbers of students arrested at school each year.
Almost (but not) all of these districts have arrest rates above the national average. NYC and Miami-Dade have very large student populations and, thus, despite (seemingly) large numbers of students arrested, their rates are below the national average (0.72 per 1,000). Most districts in this list arrested at least 5x as many students as the national average in 2021-22 though.
Some people might next ask: What are the top 20 districts by arrest rates? Others might assume those are all very small districts (this is true) but we will show in our next post, on the districts with the highest arrest rates, that we may still be able to learn some things from them.
Other people may immediately ask: what are the demographics of these districts? (or more bluntly: Do these districts primarily serve students historically arrested at the highest rates?) We will also address this in a later post on arrest rates by race.
This research was supported by a grant from the American Educational Research Association which receives funds for its “AERA Grants Program” from the National Science Foundation under NSF award NSF-DRL #1749275. Opinions reflect those of the author and do not necessarily reflect those AERA or NSF.