Another way to think about arrest rates is in terms of risk to students–the risk of being arrested. Some serious offenses may lead to arrests no matter what school students attend, but other actions – like fighting or disorderly conduct – may be dealt with through referrals to law enforcement at some schools and through school-based consequences at others.
If you’re a student trying to avoid an arrest, what’s a particularly risky district to attend?
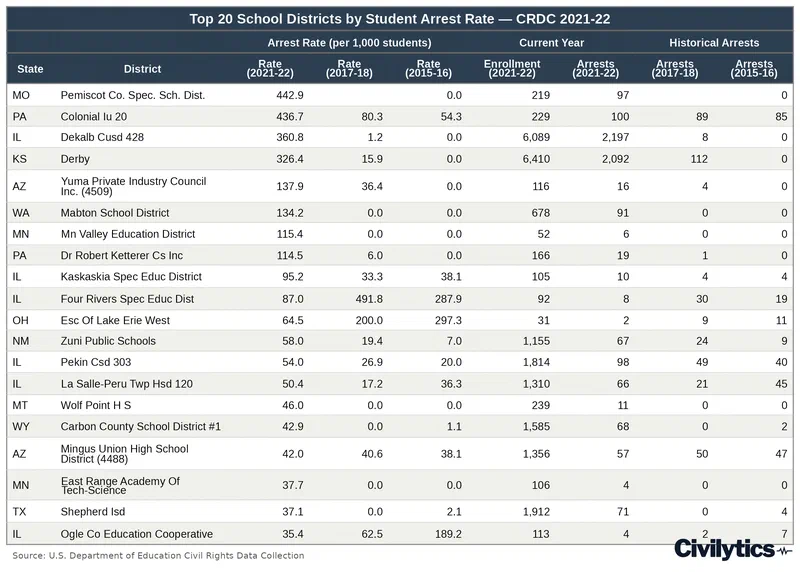
It’s not LAUSD or NYC. It might be Pekin Community High School District or La-Salle Peru Township High School District (both in Illinois) or Mingus Union High School District in Arizona. These districts consistently have arrest rates 15 to 20x the national average. They consistently arrest 20, 50, or even 100 students a year, despite having fewer than 2,000 students in their districts.
By looking at the districts with the highest arrest rates we see that that the risk isn’t the greatest in districts with the most arrests overall but in smaller districts – some of which have abnormally high arrest numbers.
The data also show:
Many very small districts with high arrest rates primarily serve students with special education needs. Research has long demonstrated that students with disabilities are disproportionately likely to be arrested (e.g., GAO 2024 (opens in new tab); Prison Policy Initiative (opens in new tab)).
At least one of these districts serves almost exclusively American Indians. American Indian students have disproportionately high arrest rates (GAO 2024 (opens in new tab)).
Several of these districts exclusively serve high school students. Of course, age is an extremely important factor in arrest rates.
Data errors (or perhaps anomalies) are more obvious with smaller populations. For example, several schools on the list reported relatively large numbers of arrests one year but 0-2 in other years.
These are mainly but not exclusively very small districts: 11 of the districts in the top 20 have <300 students. Inherently, smaller districts will have greater variation in their rates.
Next week, we’ll look more systematically at how enrollment size and arrest rates are related, and how we can use the coefficient of variation, a measure of precision, to quantify this.
This research was supported by a grant from the American Educational Research Association which receives funds for its “AERA Grants Program” from the National Science Foundation under NSF award NSF-DRL #1749275. Opinions reflect those of the author and do not necessarily reflect those AERA or NSF.