The Civil Rights Data Collection (CRDC) is the only source of data on school-related arrests for all the nation’s public schools and districts. The most recent available data, released in January 2025, are for the 2021-22 school year.
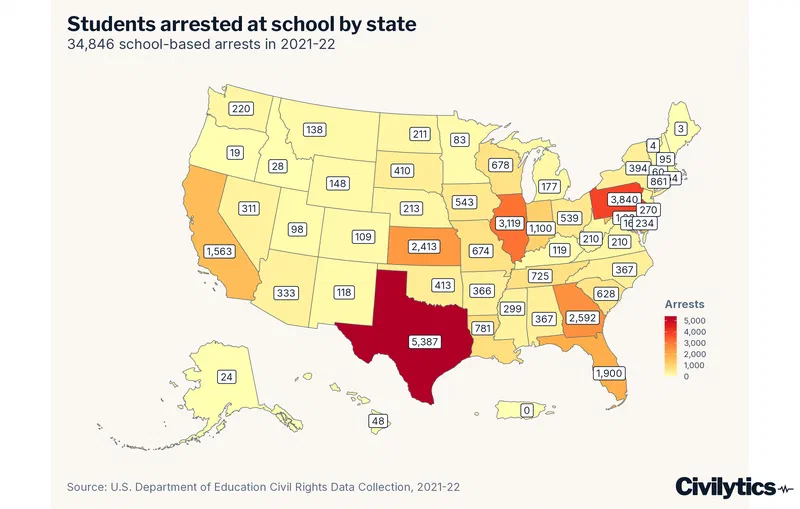
Nearly 35,000 students were arrested in “school-related arrests” in 2021-22 (34,846 students). “School-related arrests” are defined as those taking place on school grounds, while students are taking school transportation, or due to a referral by a school official.
How many students were arrested “at school/in a school-related arrest” in each state?
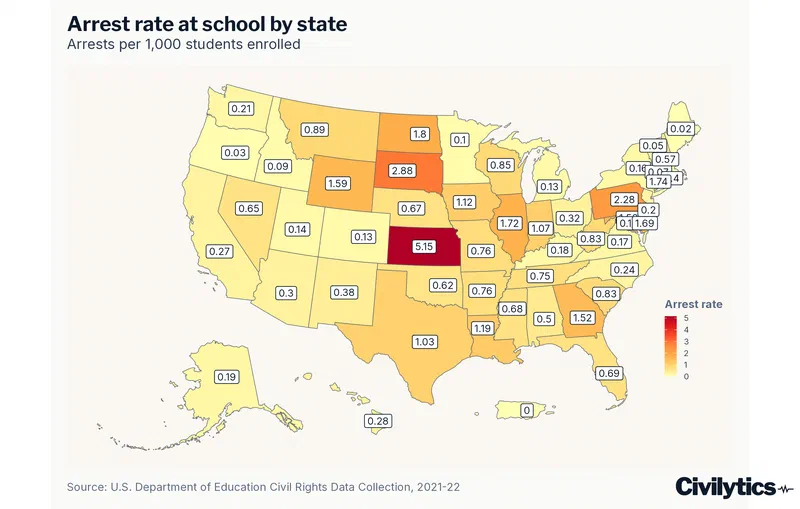
Of course, states have vastly different student populations, motivating questions about rates. The national school-related arrest rate in 2021-22 was 0.72 out of every 1,000 students. Which states had higher or lower school-related arrest rates?
Another, perhaps more intuitive approach with small rates is to calculate the “number needed to harm” (NNH) or how many students it “takes” before 1 is arrested. Nationally, 1 out of every 1,395 students was arrested “at school” in 2021-22.1 In Kansas, 1 out of every 194 students was arrested in schools. In South Dakota, 1 out of every 348 students was arrested.
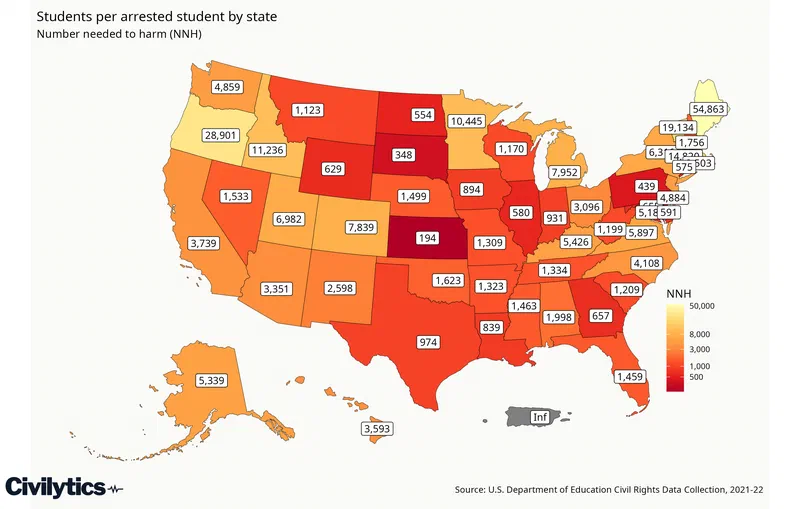
Part of what motivates this project is the challenges with rates and small Ns. Someone may reasonably think that the elevated arrest rates in South Dakota and Kansas are due at least in part to their much smaller populations (small Ns). While using rates rather than counts provides a sense of scale and standardization, rates’ sensitivity to slight differences in counts (and to the denominator) magnifies differences that may not be substantively meaningful (sometimes called the base rate fallacy) and may imply a false precision in reported numbers. By using a combination of descriptive analysis and statistics (coming in future posts), we can more accurately convey true differences in school-based arrests that are consistent with the data collected. One way to help with this is to use multiple years of measurement to accumulate a greater population over which to measure the low incident rate. Our next post will look at how the addition of prior years of data changes, or doesn’t change, this picture.
This research was supported by a grant from the American Educational Research Association which receives funds for its “AERA Grants Program” from the National Science Foundation under NSF award NSF-DRL #1749275. Opinions reflect those of the author and do not necessarily reflect those AERA or NSF.
Corrected from the originally posted “1 in 1,428.” This number-needed-to-harm uses CRDC-reported enrollment (48,596,489 students ÷ 34,846 arrests = 1 in 1,395), the exact reciprocal of the 0.72-per-1,000 national rate from the same data. The original 1,428 reflected an external national-enrollment denominator. ↩︎