In 2021-22, 2,060 school districts – just 11.6% of all districts in the data – reported at least one school-based arrest. The most common value, by far, is zero. Yet that small share of arresting districts enrolled 45% of all students, meaning nearly half of all students attended a school where an arrest occurred.
When 88% of districts report zero arrests, a key question arises: are these true zeros, or failures to report?
The table below shows why the question matters. The national average arrest rate in 2021-22 was roughly 1 arrest per 1,395 students. For a district with 20,000 or more students, that implies around 14 expected arrests. Yet 125 out of 376 large districts (33.2%) reported exactly zero arrests – a share that would be nearly impossible if the national rate applied uniformly to everyone. If arrests followed a binomial process with the national rate, we would expect essentially every district of this size to report at least one arrest.
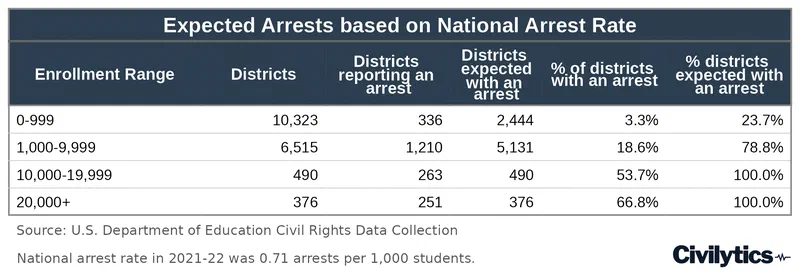
We term this level of zeros as being suspicious.
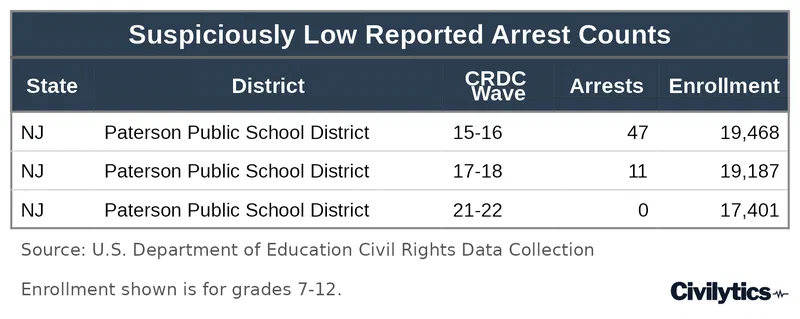
Why suspicious? Consider Paterson Public School District in New Jersey, with roughly 18,000 students enrolled in grades 7-12. The table below shows Paterson’s arrest reporting across all three CRDC waves available in these data: 47 arrests in 2015-16, 11 in 2017-18, and 0 in 2021-22. A simple review of these three values would support two possible conclusions: the district truly had 0 arrests in 2021-22 breaking from its past pattern, or the district had a reporting error in 2021-22 and the 0 is wrong.
Paterson isn’t alone - an unusually high number of large districts report 0 arrests. Despite steps taken before, during, and after data collection to ensure good data quality (Office of Civil Rights 2025 (opens in new tab)), data errors exist. The number of reported – but possibly erroneous – zeros poses challenges not just for understanding arrest patterns in particular districts, but for our whole understanding of national arrest rates.1
We’d like to be able to assess whether there was a policy change against arrests, stopping them completely, or a reporting error. Using data and statistics alone we will not be able to distinguish, but we can, with a statistical model, assign probabilities to both. Our next post will show how we can do just that for one district that reported zero arrests.
This research was supported by a grant from the American Educational Research Association which receives funds for its “AERA Grants Program” from the National Science Foundation under NSF award NSF-DRL #1749275. Opinions reflect those of the author and do not necessarily reflect those AERA or NSF.
Potentially erroneous zeros skew the distribution of arrest rates and reduce the value of summary statistics like the mean, since few districts actually sit near that average. ↩︎